0x1 前言
本文是对上述两篇文章的延伸, 不在本文中赘述leaks命令、内存文件的说明等内容.
本文将重点讲述使用appium+python对iOS项目在模拟器环境上进行自动化UI测试. 并在测试用例结束时, 通过leaks工具导出内存图文件,加以分析,来诊断当前应用程序是否存在内存问题.
0x2 安装环境
⚠️ 注意对齐版本, 版本不一致可能会导致脚本执行失败.
- 安装v2.11.4版本的appium
1
npm install -g appium@2.11.4
- 安装v4.24.0版本的selenium
1
pip3 install selenium==4.24.0
- 安装v4.1.0版本的Appium-Python-Client
1
pip3 install Appium-Python-Client==4.1.0
- 安装v7.27.0版本的xcuitest
1
appium driver install xcuitest@7.27.0
🤔 python包建议使用虚拟环境安装
0x3 脚本模版
1
2
3
4
5
6
7
8
9
10
11
12
13
14
15
16
17
18
19
20
21
22
23
24
25
26
27
28
29
30
31
32
33
34
35
36
37
38
39
40
41
42
43
44
45
46
47
48
49
50
51
52
53
54
55
56
57
58
59
60
61
62
63
64
65
66
67
from appium import webdriver
from appium.options.ios import XCUITestOptions
from appium.webdriver.common.appiumby import AppiumBy
from selenium.webdriver.support.ui import WebDriverWait
from selenium.webdriver.support import expected_conditions as EC
from selenium.common.exceptions import NoSuchElementException
import time
import subprocess
import os

cur_dirctory = os.getcwd()
app_name = "MemoryGraphDemo"
output_dir =  f"{cur_dirctory}/output"
app_file_path = f"{cur_dirctory}/app/{app_name}.app"

def init_driver():

    options = XCUITestOptions()

    options.device_name = 'iPhone 16 Pro'
    options.platform_version = '18.0'
    options.app = app_file_path
    options.automation_name = 'XCUITest'

    options.process_arguments = {'env': {'MallocStackLogging': 'YES'}}

    # 配置WDA端口 (可选)
    options.set_capability('wdaLocalPort', 8100)
    options.set_capability('noReset', False)
    options.set_capability('newCommandTimeout', 300)

    driver = webdriver.Remote('http://localhost:4723', options=options)
    return driver

def export_memory_graph():
    subprocess.run(f"leaks MemoryGraphDemo -outputGraph '{output_dir}/{app_name}'", shell=True)


def click(driver, name):
    element = driver.find_element(AppiumBy.NAME, name)
    element.click()


def test(driver):
	# UI测试用例
    time.sleep(1)
    click(driver, "登录")

def analysis():
    subprocess.run(f"leaks {output_dir}/{app_name}.memgraph -quiet > {output_dir}/analysis.txt", shell=True)

def main():
    driver = init_driver()

    try:
        test(driver)
        export_memory_graph()
        analysis()

    finally:
        driver.quit()


if __name__ == "__main__":
    main()
0x4 脚本说明
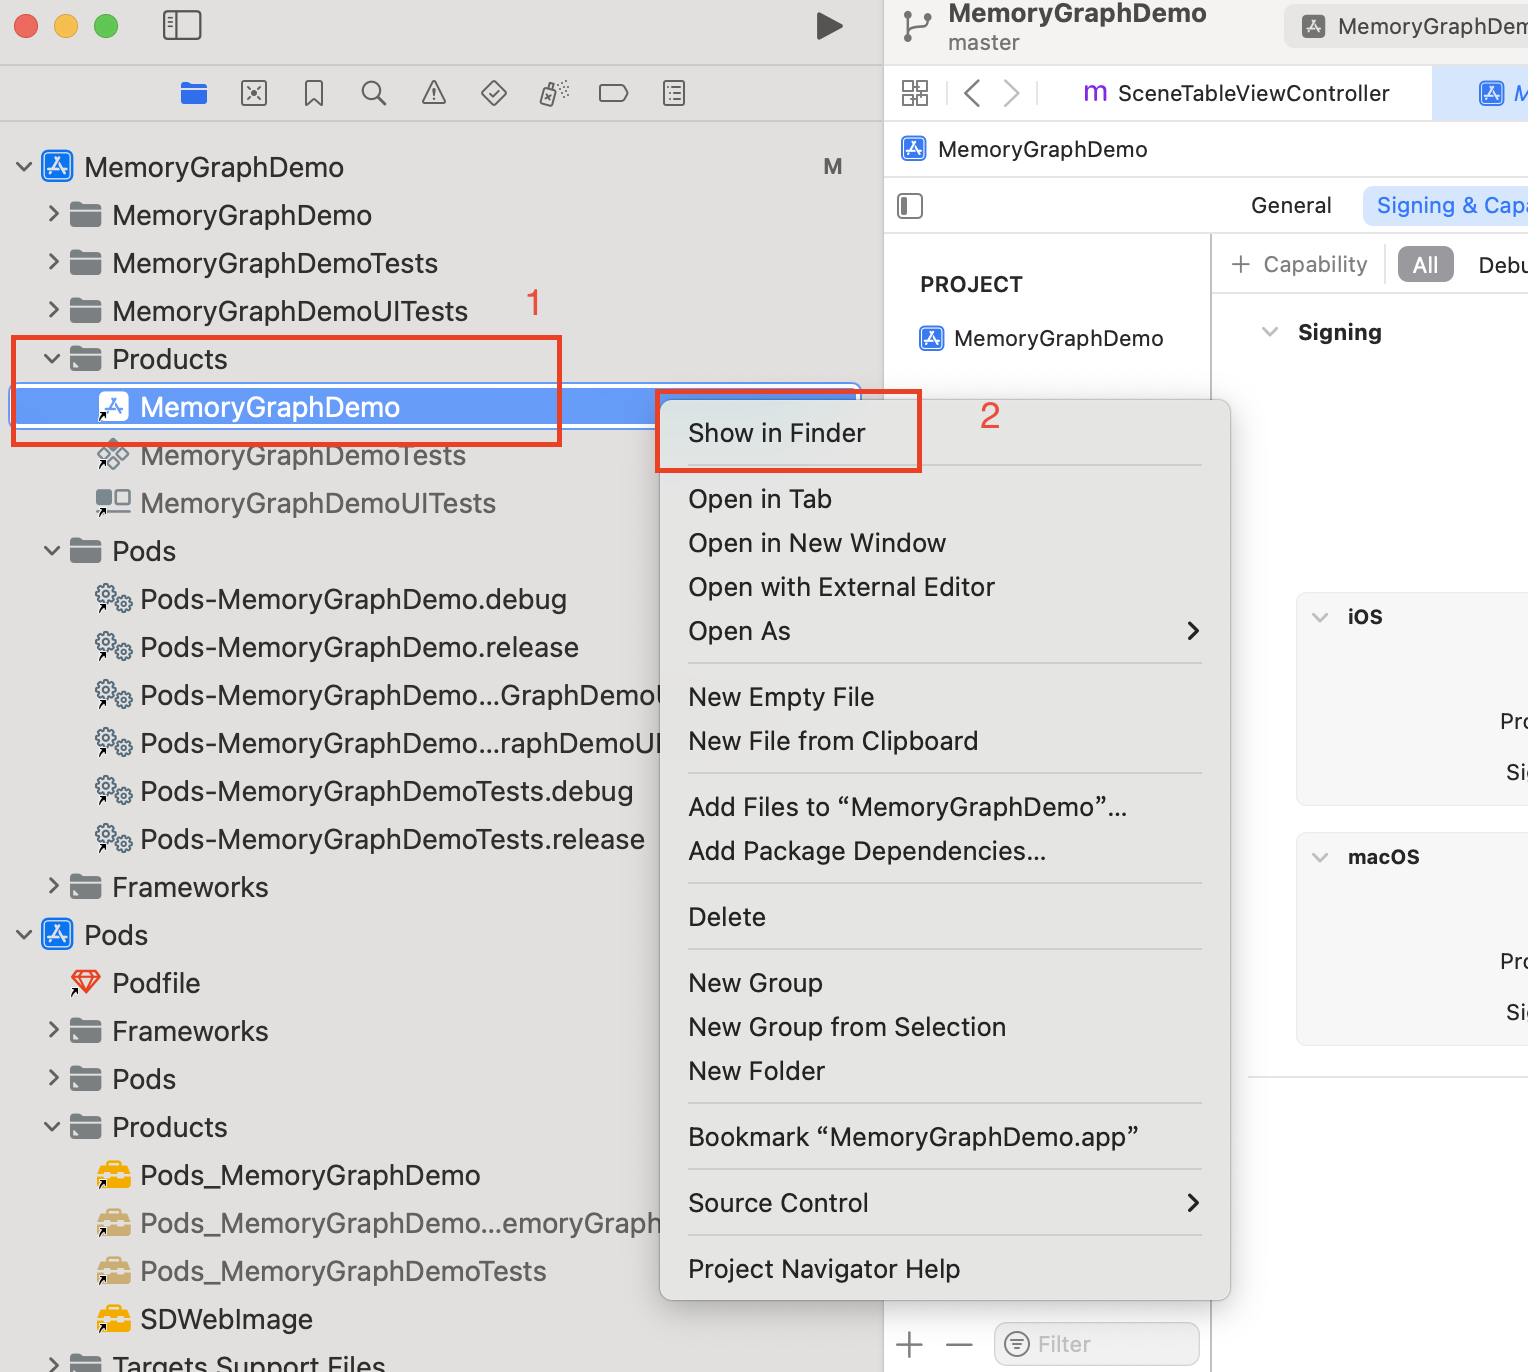
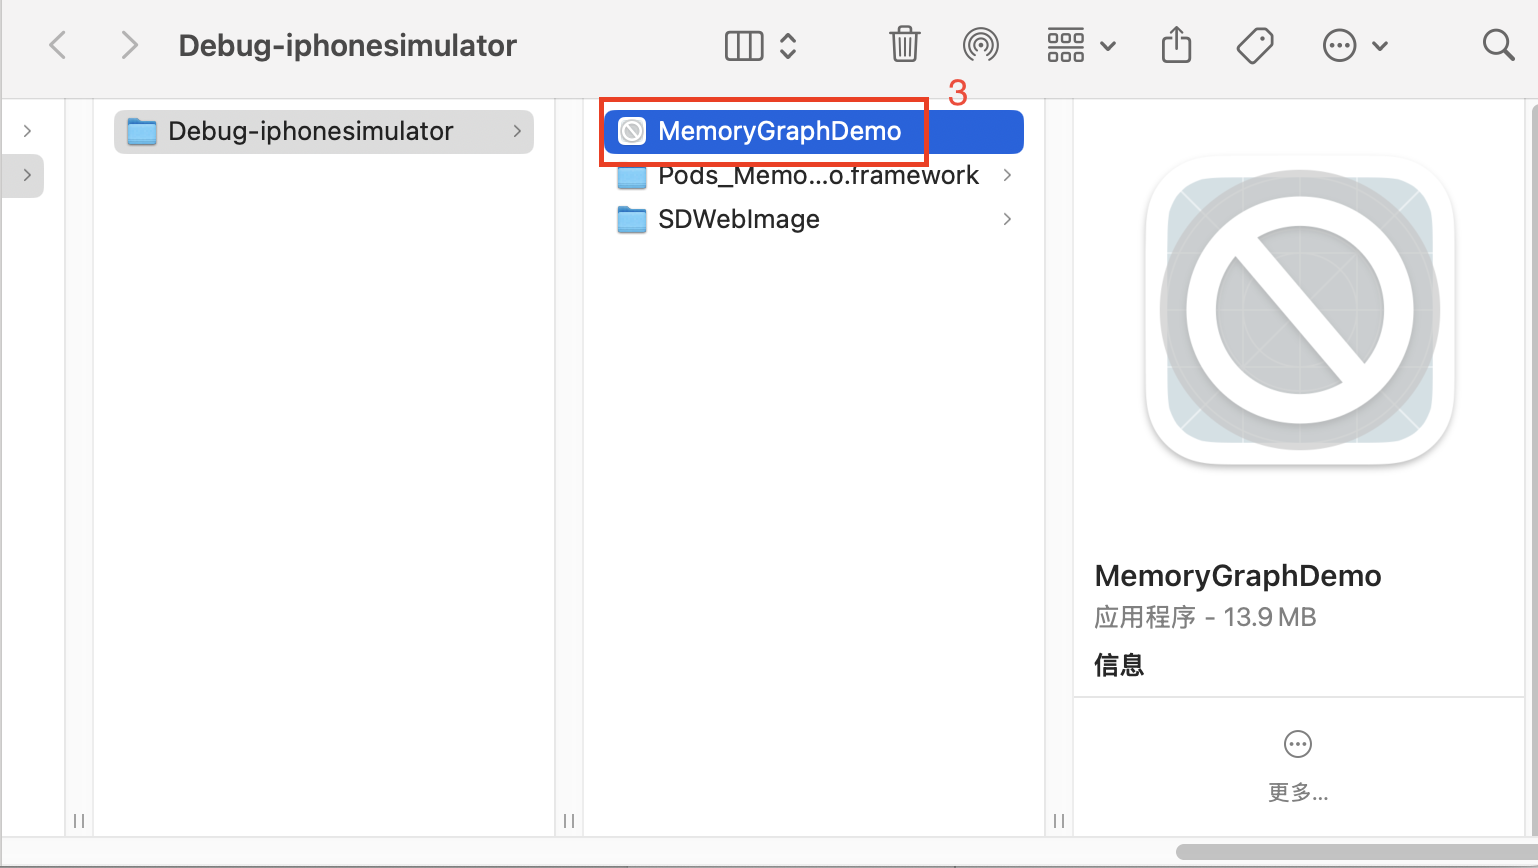
app_name: 测试项目的二进制名称. ⚠️按需修改为自己测试的app名称output_dir: 内存图文件、分析结果输出目录. ⚠️ 目标目录需要存在app_file_path: 项目的编译产物. .app文件. 可通过Xcode在文件目录中Products文件夹下找到.
options.device_name: 运行脚本的模拟器器设备名称. 可通过xcrun simctl list命令查看模拟器列表options.platform_version: 运行脚本的模拟器设备系统版本options.set_capability('noReset', True): 每次执行脚本是否重启app项目options.process_arguments = {'env': {'MallocStackLogging': 'YES'}}: 使leaks工具记录对象创建的堆栈信息test(driver): 对项目执行的测试用例. 比如, 完整的订单流程、下单、接单、发货等自动化UI测试流程export_memory_graph(): 使用leaks工具将内存图xxx.memgraph文件导出到output_dir目录下.analysis(): 对导出的xxx.memgraph文件进行分析. 并将结果analysis.txt文件输出到ouput_dir目录下
man leaks

> If the MallocStackLogging environment variable was set when the application was launched, leaks also prints a stack trace describing where the buffer was allocated.
0x5 Demo
完整流程可以参照这个项目MemoryGraphDemo.
- clone 项目
1
git clone https://github.com/tuyuwang/MemoryGraphDemo.git
- 按默认配置启动appium
1
appium
- 另启一个终端将切换路径到
MemoryGraphDemo/Scripts目录下1
cd MemoryGraphDemo/Scripts
- 运行
appium_leak.py脚本文件1
python3 MemoryGraphDemo/Scripts/appium_leak.py
- 查看分析结果
1
cat MemoryGraphDemo/Scripts/output/analysis.txt
内存分析结果的解读可参考这篇文章的内容iOS 内存优化之工具介绍
以下是该demo的完整流程视频演示: